
The last week of October gave northeast Florida a preview. A king tide, among the highest tides of the year, arrived on top of a nor'easter, and the two stacked into something bigger than either would have been alone.
On October 26, water in St. Augustine rose about two feet above the predicted tide, according to local reporting. Streets near Flagler College and City Hall flooded that morning. To understand how a storm reaches that far inland, it helps to know where the water starts.
At the beach, a high tide gives waves a chance to reach farther up the shore. When a nor'easter coincides with one of the highest tides of the year, waves can reach parts of the dune that usually sit well above the water.
At Vilano Beach, St. Johns County and the U.S. Army Corps of Engineers completed two rounds of beach nourishment, one in 2020–21 and another in 2023–24. After a week like this one, I'd want to see how the different stretches of that beach held up.
The baseline keeps moving
At Mayport, the tide gauge gives us nearly a century of local context. Over the full record, water levels have risen relative to the land. The average rate was higher over the most recent 26 years.
That gradual rise matters on a stormy morning. As mean sea level rises, a storm of the same strength can push water farther inland. How far it reaches on any particular day still depends on the tide, wind, waves, and shape of the shore.
A king tide gives you a chance to see which low roads and marsh edges the water reaches today. A photo taken on a calm high tide gives you something to compare with the same view after a storm.
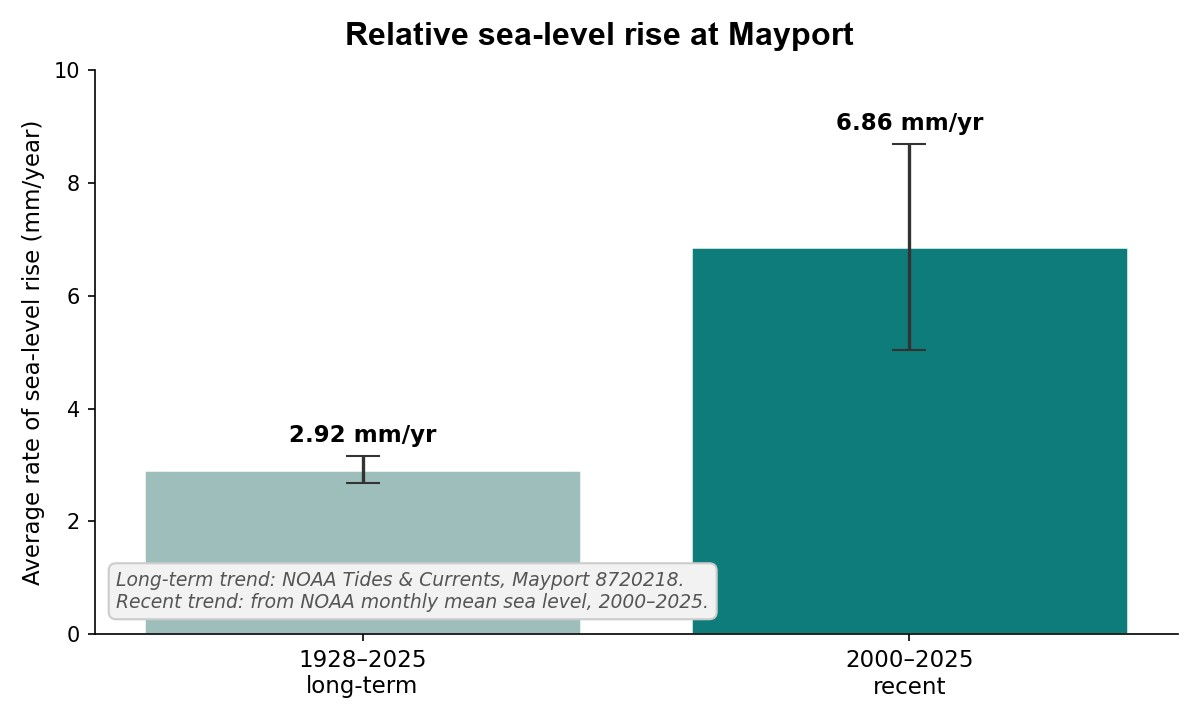
Relative sea-level rise at Mayport, Florida (NOAA station 8720218). NOAA reports 2.92 mm/year for 1928–2025. I estimate 6.86 mm/year for 2000–2025 using NOAA monthly mean sea levels.
What I do
I run First Coast Ecological Services, a coastal monitoring and mapping firm in northeast Florida. Before that I spent 23 years as a federal scientist, first with the U.S. Geological Survey and then with the National Park Service's Southeast Coast Inventory and Monitoring Network, measuring shoreline position, marsh elevation, and how fast the water is gaining.
We establish a measured baseline of a shoreline's condition and re-measure it on a schedule, so change shows up as numbers instead of surprises. We have monitored shorelines from Cape Hatteras and the Outer Banks to Canaveral, including through multi-year programs at Fort Matanzas and Canaveral. We have also installed surface elevation tables that track marshes millimeter by millimeter, and we use survey-grade GNSS equipment.
Municipalities and coastal managers need this because every dollar spent on a shoreline is a bet. A renourishment project costs millions, and without a measured baseline there is no way to say whether it worked, how long it held, or where the sand went. Surveys turn those bets into records: which stretches are losing ground fastest, which projects held up, and what the shoreline looked like before the storm hit. Grant applications, permit decisions, and disaster-recovery claims are all built on that kind of record. You cannot document a loss you never measured.
At Vilano, repeat surveys could show where the beach narrowed after October's high water and which stretches regain sand in the months ahead.
When I monitored the shoreline at Canaveral National Seashore in 2022, I had a spring survey to compare with the one we made after Hurricanes Ian and Nicole. A photo taken after the storms could show a steep cut in the beach. What I wanted to know was where the shoreline had been before the storms and how far it had moved. When I compared the two surveys, I could pick out stretches where the fall shoreline sat as much as 35 meters landward of its spring position. That's the question I'd ask at Vilano now. Where did the shoreline move the most, and how much of that ground will the beach regain?
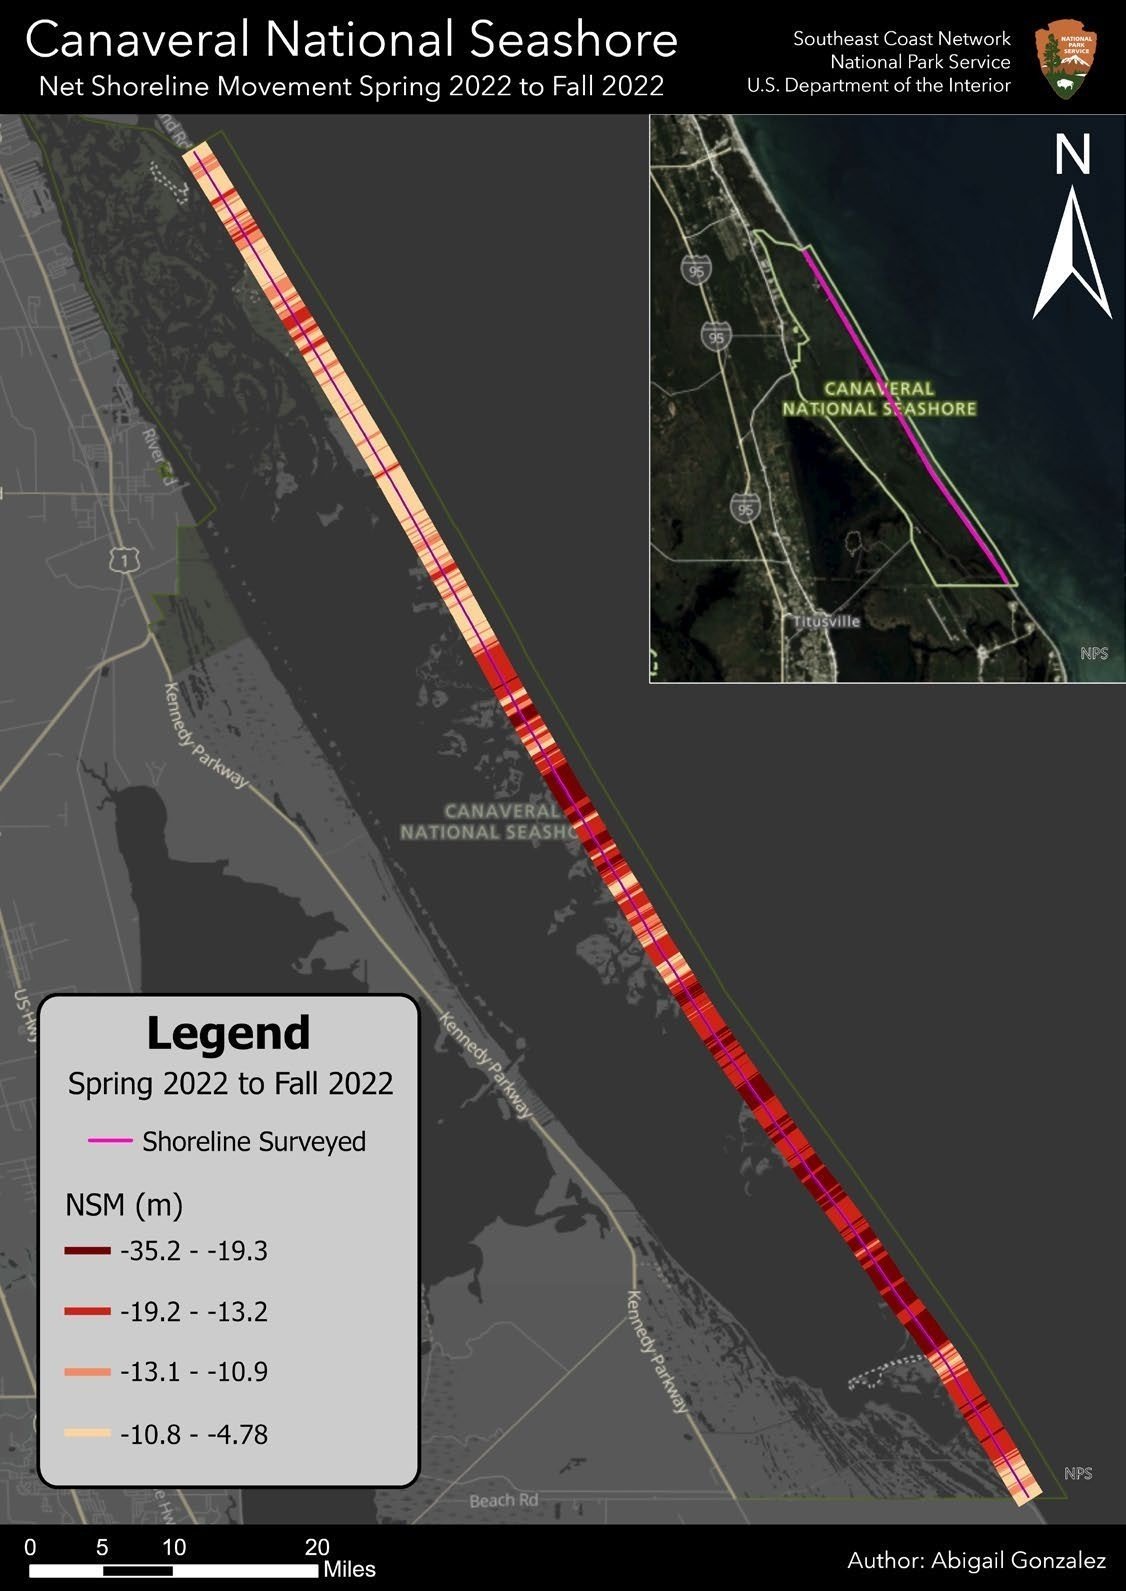
Measured shoreline change at Canaveral National Seashore, spring to fall 2022. Red segments show up to 35 meters of shoreline retreat in a single storm season. Source: post-Hurricane Ian/Nicole shoreline-change report.
Go look November 7–9
St. Augustine's king tide calendar lists November 7–9 and November 23–27. If you live or work near the water, pick a spot you can return to at high tide. A fixed landmark like a dock piling or the corner of a seawall makes it easier to line up the next photo.
Take a photo during the first window and write down the time and where the water reached. Come back later in November and take the same photo again. That's the start of a shoreline record.
First Coast Ecological Services LLC — coastal monitoring and mapping for a changing shoreline.
